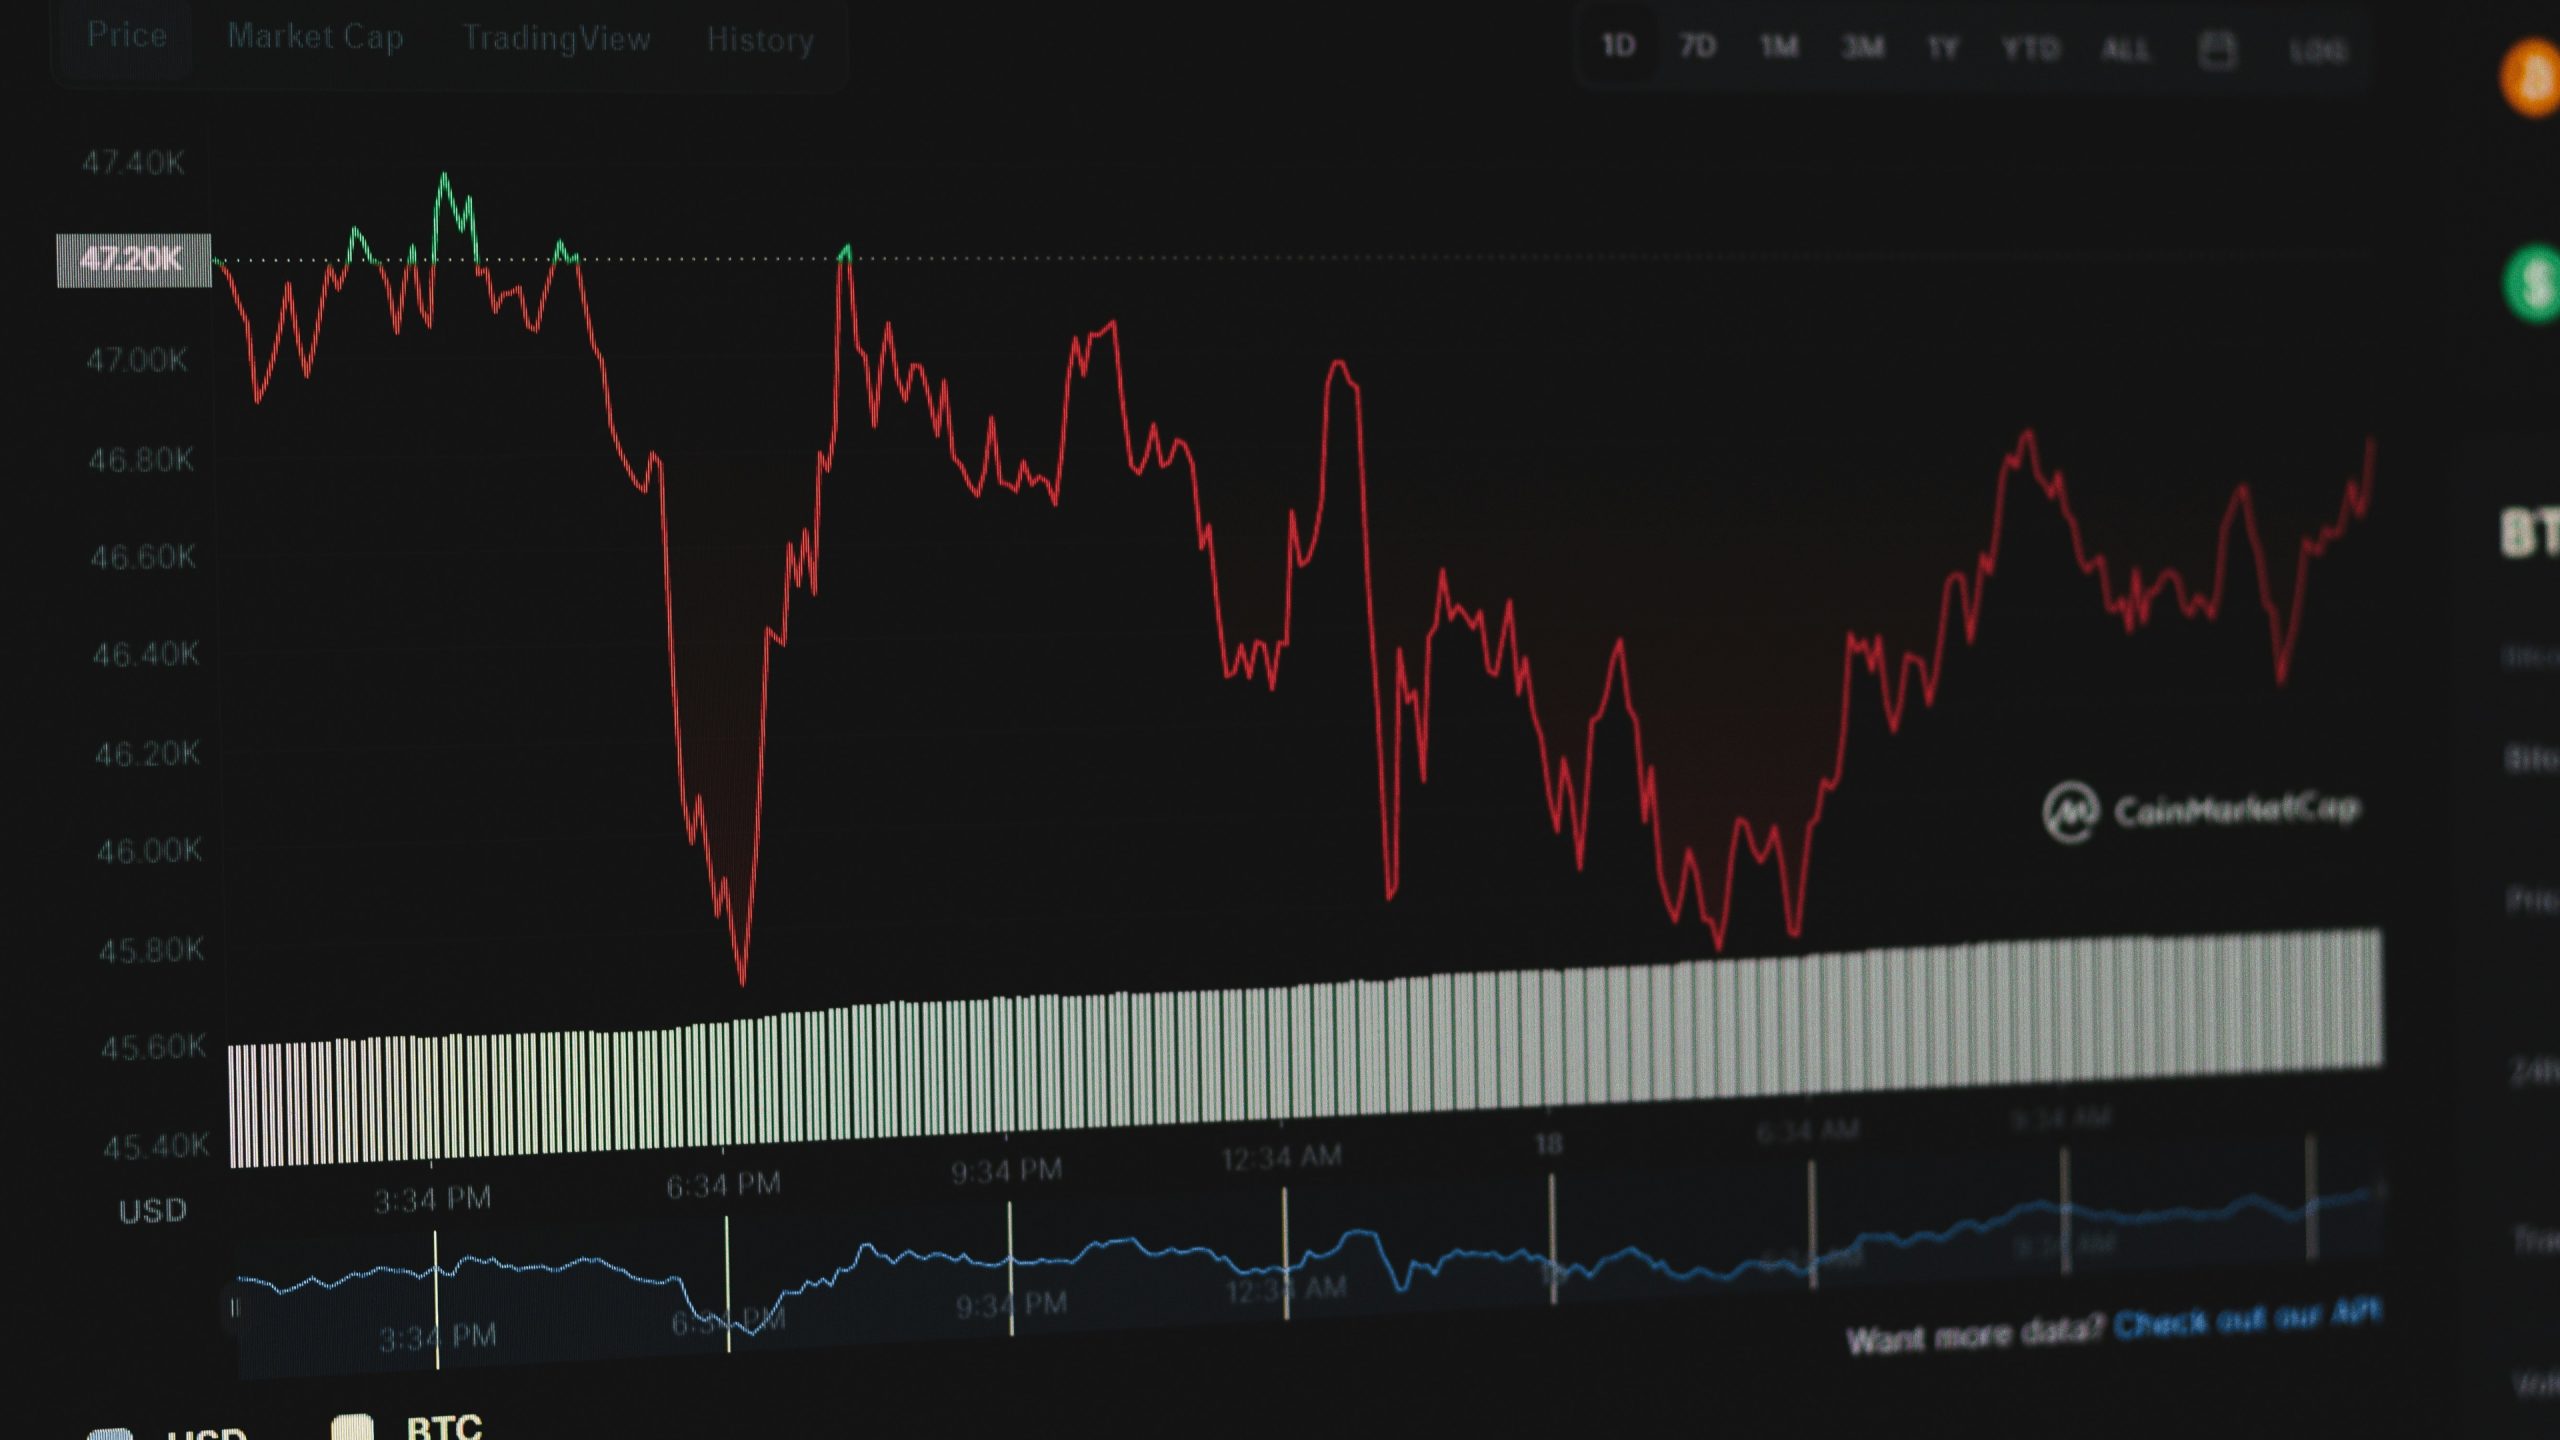
As of July 10, 2025, the Nasdaq 100 index has reached a new all-time high, closing at 22,915.02 on July 8. This significant milestone underscores the continued strength of major tech stocks and strong investor confidence. However, despite the bullish momentum, several Nasdaq 100 bearish signs are beginning to appear. These technical warning signals may indicate that the current uptrend is weakening and a shift in sentiment is underway.
Double Top Pattern May Be Forming
One of the most notable Nasdaq 100 bearish signs is the potential formation of a double top pattern. The index previously encountered resistance around the 20,000 mark before retreating. Now that prices are testing higher levels again, traders are watching closely to see if the Nasdaq 100 can push beyond its recent peak. Failure to do so—combined with a drop below key support levels—could confirm a bearish reversal. A double top typically signals exhaustion in an ongoing trend and may precede a downward correction.
RSI Divergence Highlights Slowing Momentum
Another classic Nasdaq 100 bearish sign is the divergence in the Relative Strength Index (RSI). Although the index is printing new highs, the RSI has not followed suit and instead appears to be leveling off or even declining. This divergence suggests that buying momentum is fading, which could lead to a loss of upward pressure. When momentum fails to support price movement, a pullback or period of consolidation often follows.
Support Levels Are Being Tested
Support levels near 22,500 and 22,000 are now under pressure. A decisive drop below these zones could confirm a bearish shift and open the door to further losses. Conversely, holding above these support levels would help preserve the bullish narrative. Traders are analyzing both volume and closing prices at these thresholds for confirmation.
Caution Warranted as Nasdaq 100 Bearish Signs Grow
While the longer-term trend for the Nasdaq 100 remains positive, the rise in bearish signals should not be ignored. With a potential double top, RSI divergence, and key support levels under threat, the outlook is becoming more uncertain. Traders and investors would be wise to monitor these developments closely and adjust their strategies accordingly.


